First tier complaints report
July 2019
Why did we carry out this analysis?
Solicitors have a duty to provide a good standard of service, as we set out in our mandatory Principles and as set out in the Legal Services Act. Complaints are an important indicator of service quality. We ask firms to report annually to us on the number of complaints:
- they receive from their clients
- they resolve.
We have committed to publishing our first tier complaints data annually. This is part of our commitment to improve information about legal services. Sharing these findings will:
- benefit people by raising awareness about complaint handling
- help firms to use this information to improve their standards of service.
Complaint process
When clients are dissatisfied with the service of a firm, they can complain directly to the firm. These are known as a ‘first tier complaint’ (FTC). Law firms have eight weeks after receiving an FTC to provide their final written response.
The outcome can be:
- resolved – firm resolves the complaint to the satisfaction of the client
- unresolved – firm is unable to resolve the complaint.
When a firm is unable to resolve the complaint, clients can contact LeO.
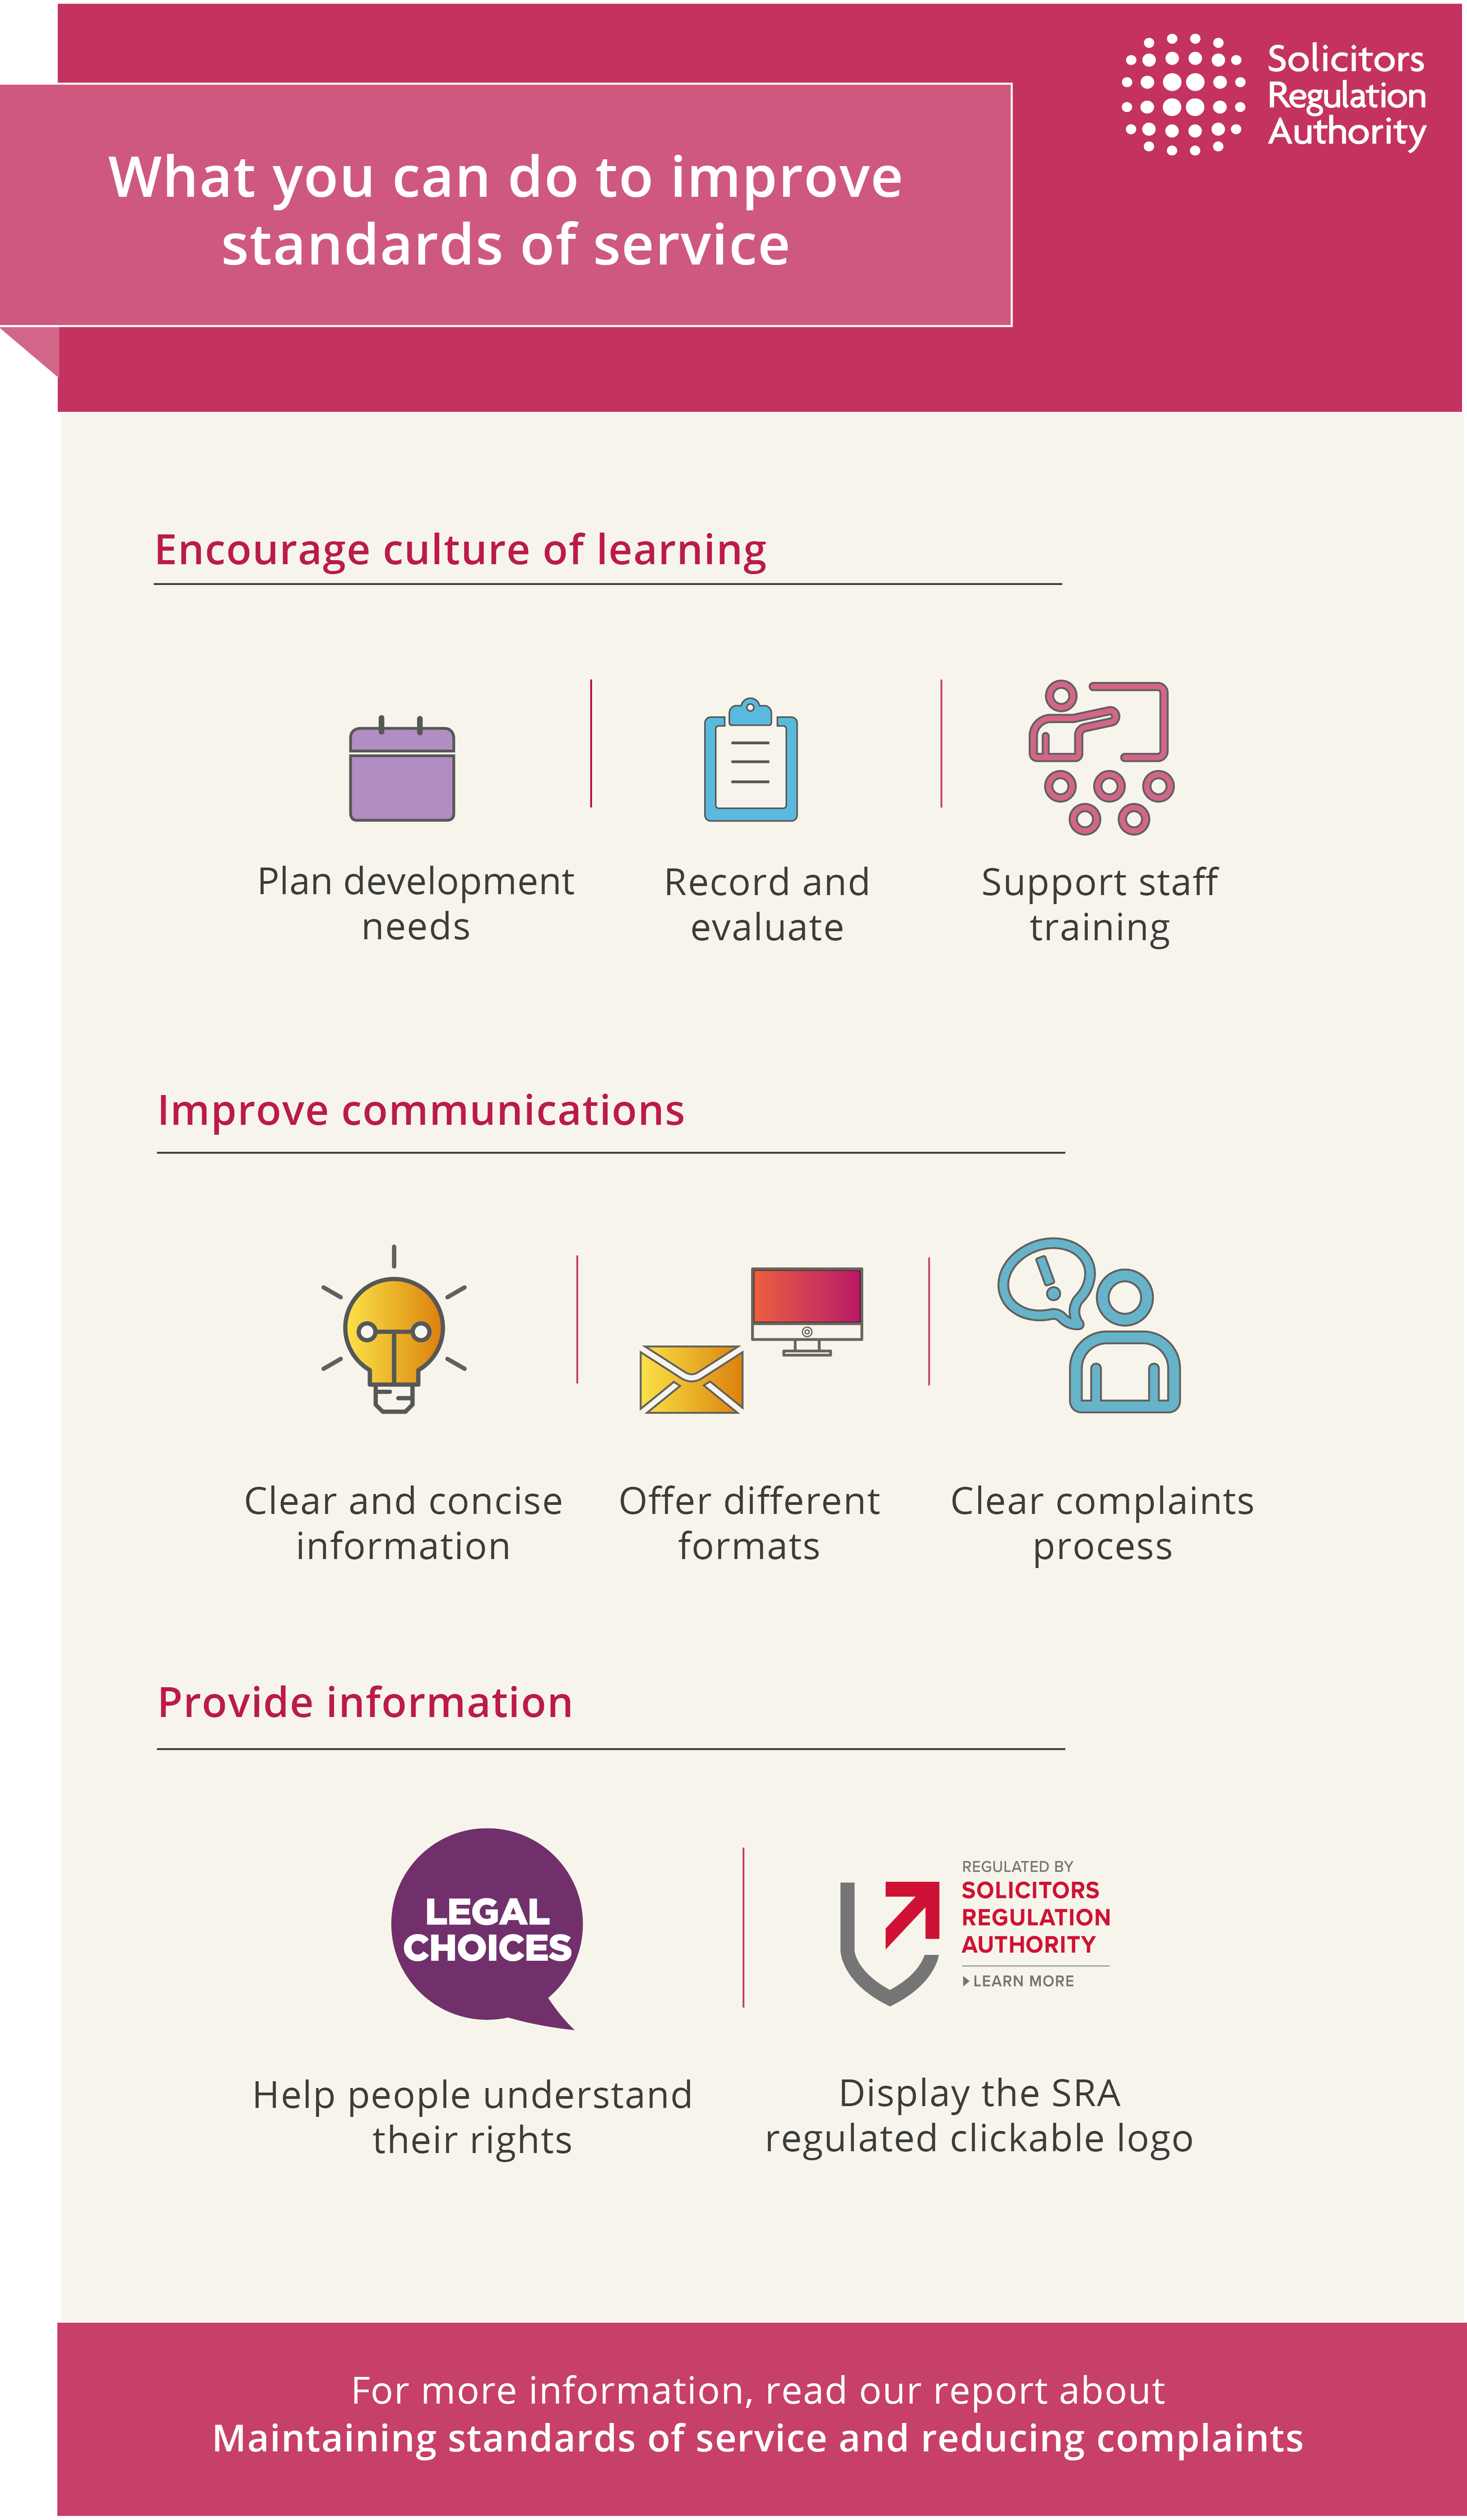
Our report about Maintaining standards of service and reducing complaints highlights the business benefits of getting feedback from clients. Firms can use these findings to improve their complaint handling processes.
Number of complaints
The number of FTCs received has increased from 26,570 in 2012 to 28,113 in 2018. The Legal Services Consumer Panel's annual tracker survey also shows that there has been a reduction in 'silent sufferers' - those people who are dissatisfied but do not make a complaint - over the last few years.
Number of FTCs received each year
Small, medium and large firms receive proportionally more FTCs compared to their volume of work. And very large firms receive proportionally less FTCs compared to the volume of their work. This is likely to be because very large firms generate most of their turnover from large corporate clients who would not use the same FTC process as individual clients, as they have other routes to redress if there is poor service.
Proportion of FTCs received by size of firm
| Proportion of number of all firms | Proportion of turnover of all firms | Proportion of all FTCs received | |
|---|---|---|---|
| Small | 49% | 3% | 6% |
| Medium | 30% | 13% | 29% |
| Large | 9% | 29% | 49% |
| Very large | 1% | 54% | 14% |
Most common complaints
The most common complaints received are about:
- delay
- failure to advise
- excessive costs.
Proportion of complaint types received 2012-2018
| Complaints type | Overall |
|---|---|
| Delay | 18.5% |
| Other | 15.9% |
| Failure to advise | 13.5% |
| Costs excessive | 11.2% |
| Failure to keep informed | 9.1% |
| Failure to progress | 8.7% |
| Conduct | 8.6% |
| Failure to follow instructions | 7.3% |
| Costs information deficient | 4.7% |
| Data protection | 0.9% |
| Failure to keep papers safe | 0.9% |
| Failure to investigate complaint internally | 0.3% |
| Failure to comply with agreed remedy | 0.2% |
| Discrimination | 0.1% |
| Criminal activity | 0% |
The complaint category type ‘other’ is also one of the most common. We do not have any details about what these complaints are so are unable to draw any conclusions about these from the data.
Resolving complaints
The number of FTCs resolved has increased from 19,089 in 2012 to 22,847 in 2018.
Number of complaints resolved each year
There has also been an upward trend in the proportion of FTCs resolved over the same period. For example, in 2012 firms resolved 72% of all complaints received, which increased to 81% in 2018.
Proportion of complaints resolved
Most commonly resolved types of complaints
The most commonly resolved complaint types over the last seven years are delay, failure to advise and excessive costs. These are the same as the most commonly received FTCs.
Complaints resolved by complaint type 2012-2018
Firm size and location
There is a correlation between the size of firm and resolution of complaints: the larger the firm the more likely a complaint will be resolved. This is likely to be because larger firms have dedicated resources to handle complaints.
There is no relationship between the location of the firm and the number or types of complaints resolved.
Conclusion
Over the last seven years, firms have received an increasing number of FTCs. However, firms' reports to us show that they are also resolving a higher proportion of the complaints. In 2018 the proportion of resolved complaints was nine percentage points higher than in 2012, despite having received a higher number of complaints.
Firms can use this information to:
- help improve their standards of service, by encouraging an open culture of complaints within their businesses which can improve the way complaints are handled and how individuals learn from complaints
- benchmark themselves against this aggregate data and take action to improve their service and complaints process where needed.
Our Risk Outlook and report about Maintaining standards of service and reducing complaints give more information about the risk of a poor standard of service and the benefits of improving these standards. And see our research about FTCs and our Better Information work for more information about reducing complaints and improving the information given to the public.
